Dirty 12 and Clean 15

It’s that time of year again, when the Environmental Working Group (EWG) publishes their list of dirtiest and cleanest fruits and vegetables with regard to pesticide residue. I’m no fan of pesticides but sometimes they can’t be avoided (as hard as I try), even with proper washing procedures; still, in my mind an apple is healthier than a Special K Bar (40 ingredients, 40! Including chemicals, soy, corn, milk, wheat, rice, and four different low quality oils-and in the Strawberry Bar, there are no strawberries, but artificially flavored cranberries!). Healthy snacking, Special K diet MY ASS.

See the updated list below:dirty-dozen-and-clean-15-2013-411x540

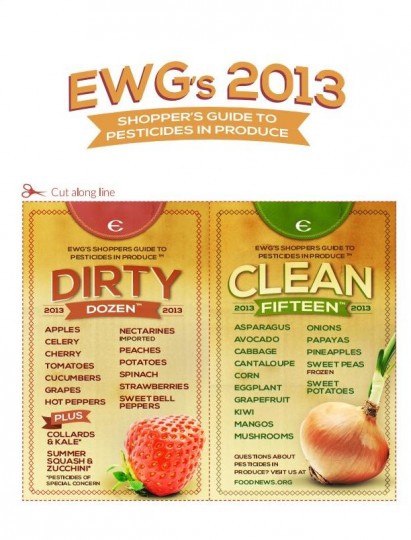
You can find more information at the EWG’s website about methodology and even more detailed lists here!

Thanks to Ingredients of Wellness for the photo.

Seasonality of Produce

Knowing when produce is in season is important. Not only is the flavor on in season produce better, but there have been studies that show eating items in season, contain more nutrients (because they aren’t forced to grow when they normally wouldn’t, enter fertilizers, pesticides, etc.), help farmers, and our economy. If you think about it, not that long ago at all, you couldn’t find every single kind of produce year around, like you can now. Seriously, think about it.

I found this post on what to eat, when, it’s an infographic called The Bountiful Year: http://dailyinfographic.com/what-to-eat-when-to-eat-it-infographic. It has a really awesome list of fruits and vegetables, when they’re in season, and when they are available but not in season.

Here’s another seasonal chart, that includes herbs (again, I love this website!): http://dailyinfographic.com/fruitsvegetablesherbs-when-are-they-in-season-infographic

I LOVE this website (being the chart loving visual learner that I am)! It’s called The Daily Infographic. Each day it has an educational graphic posted about any random topic: http://dailyinfographic.com/